A recent report highlighted the decline in oil inventories after a strong build at the start of 2023, which was likely driven by lower demand in January, given the mild weather and production recovering from December’s weather disruptions.
The report – issued by the Swiss investment bank “UBS” – stated that February data indicated a strong increase in demand, which led to a modest shortage in supply in the market during that month.
Oil stocks showed a mixed picture, with visible onshore stocks declining strongly in recent weeks, but “transit” oil due to Western sanctions on Russia rose at high levels, according to the report, a copy of which was obtained by the specialized energy platform.
The report also emphasized that voluntary production cuts by some OPEC+ members should lead to tighter supply in the oil market from May onwards, supporting oil prices.
The decline in oil stocks and its repercussions
Recent data showed a renewed significant drawdown in onshore inventories of more than 30 million barrels over the past 3 weeks across the US, Europe, Singapore, Japan and Fujairah, suggesting that the market remained undersupplied in March as well.
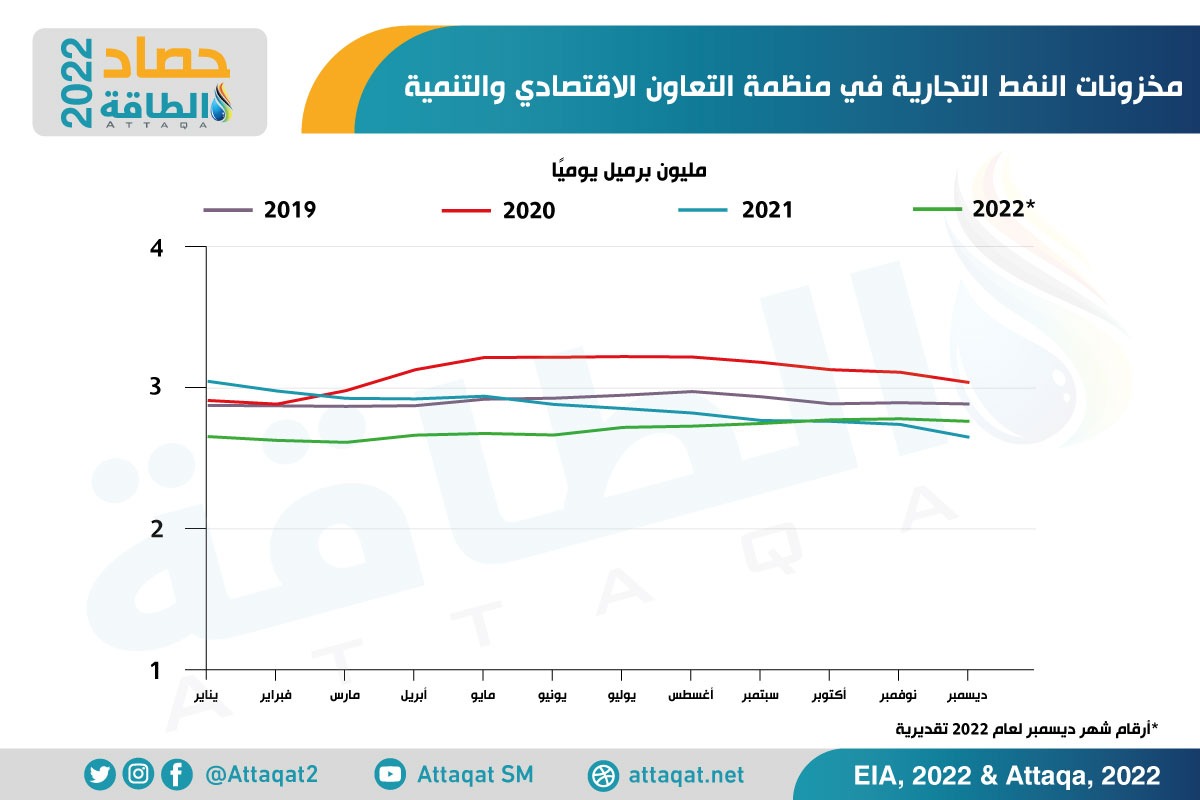
The following chart – prepared by the specialized energy platform – shows commercial oil stocks in the Organization for Economic Co-operation and Development, from 2019 to 2022:

Moreover, the report indicated that exports from northern Iraq, amounting to about 500,000 barrels per day, have been halted since late March, and pumping has not yet resumed.
Although flows may resume in the short term, this halt and the upcoming voluntary production cut by 9 OPEC+ countries would help further tighten supplies in the oil market.
“As a result, we still expect oil prices to rebound around $100 a barrel over the coming quarters,” UBS analysts said.
Significant rise in transit oil
In a related context, the report stated that the international oil sanctions imposed on Russia distorted one part of the market equation. Namely, transit oil, which has risen sharply over the past 12 months.
“In our view, this increase was driven by the G-7 countries as the European Union and Australia stopped importing oil via tankers from Russia,” said Giovanni Stanovo, a commodities analyst at Swiss bank UBS, co-authoring the report.

Hence, Russia diverts more of its crude oil to countries outside the European Union, while Europe imports its crude from faraway locations such as North America, South America, Africa, or the Middle East.
Longer routes mean shipped oil spends more time on a tanker, and the change is structural, like new pipelines that need to be filled.
It is noteworthy that the countries of the European Union imposed an embargo on Russian oil supplies transported by sea since December 5, 2022, followed by an embargo on Russian derivatives on February 5, 2023.
Tips for investors
Given the positive outlook for oil prices, UBS analysts continued to advise aggressive investors to add long positions in long-term Brent crude contracts, with the slope of the oil futures curve and potential price hikes in the future.
Alternatively, investors can take advantage of lower spot prices by selling the risk of a lower Brent crude price over the next 6 months, or selling first-generation Brent crude indices.
However, given the 30-40% fluctuation in oil prices, this strategy requires investors to bear a “high appetite” for risk, according to the report.
“We would prefer to get exposure to oil via Brent crude, rather than WTI,” the analysts said.
As political uncertainty mounts, the US administration could, for example, ban exports of refined products and eventually ban crude oil.
While the probability of this event is low, such a decision could severely affect prices in the US.
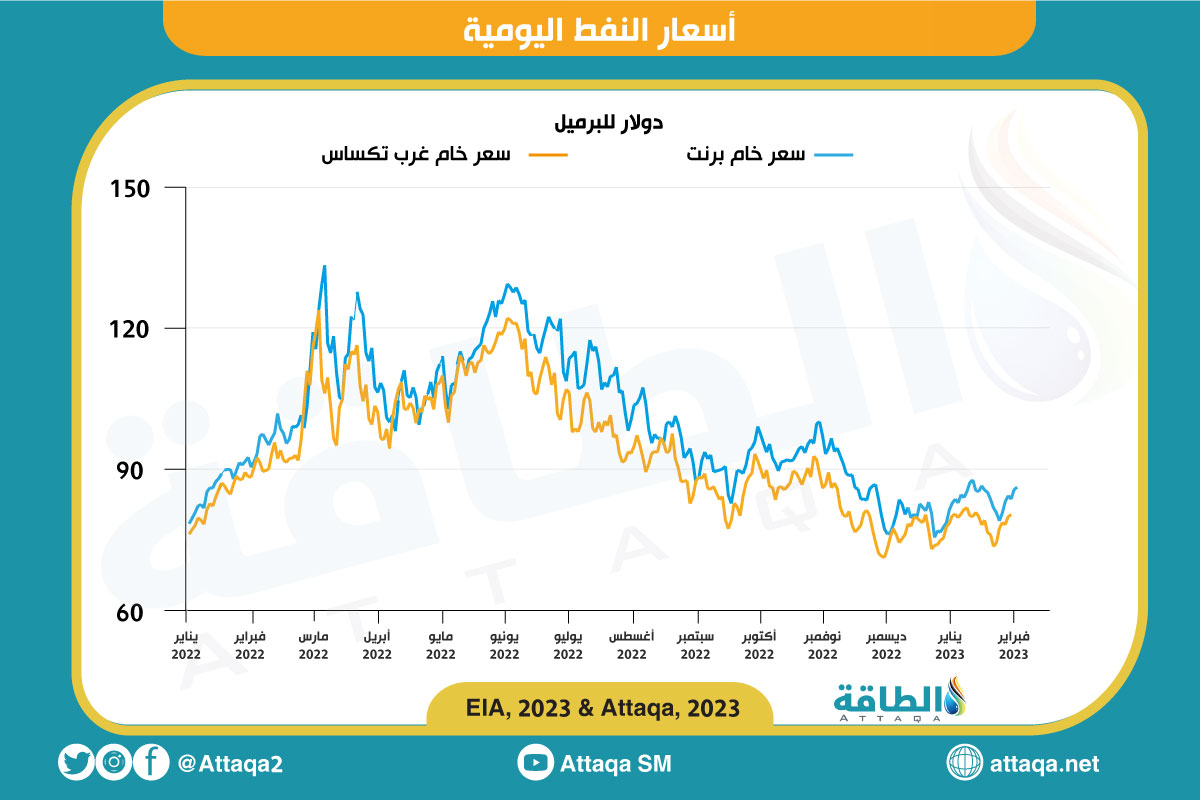
The following chart – prepared by the specialized energy platform – shows daily oil prices since the outbreak of the Russian war in Ukraine:

Oil market analysis
The report referred to how to analyze the oil market, as UBS relies heavily on inventory data to evaluate market balances, because the data is released to several locations on a consistent weekly basis.
Reliance on oil production and demand data can be more accurate, at least in the short term.
While oil production can be easily tracked in some countries, particularly in oil-exporting countries with low domestic consumption, as one can count oil tankers, others such as the United States release final production data late.
Calculating oil demand is even more complex, as incomplete and inaccurate data from emerging markets, which account for roughly 55% of total demand, and a lack of detailed consumption breakdowns — for example, whether consumers are stocking barrels in tanks — can result. For later use or immediate consumption – to errors.
Another challenge comes from historical reviews, as the application is finally reviewed after years.
Oil stocks.. “real-time” indicators
The report emphasized that the data on oil stocks is also not perfect, given that some emerging markets do not disclose their stocks.
However, data on wild stocks from the developed world, OECD countries, industry, or government-controlled sources is very accurate.
Moreover, it is possible to track whether oil is being transported or stored on ships (floating storage), or in above-ground tanks thanks to floating-roof tanks, thanks to satellites, but it is not possible for underground caves.
“Although we can accurately measure only a small fraction of all oil inventories around the world, we can make assumptions about the overall market based on visible oil inventories,” the analysts said.
If oil stocks rise, the market is oversupplied, and vice versa if the supply is insufficient.
If the visible part is going up or down, it is very likely that Emerging Markets Commercial Oil Inventories are going up or down as well.
This is because a shortage or excess in one place causes prices to adjust in that location, which either draws oil from the rest of the world to that location, or sends it elsewhere.
The report indicated that the only exception is that emerging countries – such as China – have strategic oil reserves, which would send the wrong message: stocks do not rise due to an increase in market supply, but because of a government decision.
related topics..
Also read..

Leave a Reply